Using the BLSCAN and
BJBLSCAN programs to find digital satellite feeds.
Many people have
heard of, or have a Broadlogic 1030 DVB PCI card. I don't think
Broadlogic 1030s are sold new anymore, but you can find them on EBAY,
usually for less than $50. This is a card similar to the popular
Twinhan card, but not quite as popular because it is somewhat limited
in it's capability. Those with the Broadlogic card are probably aware
of the Broadlogic spectrum analyzer, which is a home-made
spectrum analyzer made by modifying a Broadlogic PCI DVB card.
However, you can still get a reasonable, albeit SLOW spectrum scan with
a Broadlogic card that has NOT been modified. To do this, you
need the BLSCAN.EXE program written by Hans van Oostrom. This program
is available free on his web page { http://www.dvbapps.com/ ), although
you must register first to get access to his download page.
Once you have the BLSCAN program, a scan with it
typically takes from 5-10 minutes, depending on what resolution you
choose. I have only tested the program using 1 mhz resolution and a
500MHz span. Ie for C-band, do the following: blscan 3700 4200
`1000 v blout.csv , and for KU-band do blscan 11700 12200 1000 v
blout.csv . This will do a 500 MHz scan with 1 MHz resolution.
Once you complete the scan, the results of the
scan will
be a .csv file, which is a comma deliminated text file. The file's name
is blout.csv, and it
will over-write the previous scan
with that file-name, so if you want to save scans, re-name the
files. The output file is
not
very informative just looking at the listing of numbers. However,
I wrote a crude Visual Basic program to plot out this data. My
program is called BJBLSCAN.EXE. It's available free at http://www.eskerridge.com/bj/sat/bjblscan.zip
. When you run bjblscan.exe, click on "New File", and it will
load the blout.csv file from the blscan program. It initially
only displays a plot of
the satellite's signals. It also displays frequency and signal
strength indications at the top right. If you see a peak that you want
located more accurately, place your mouse pointer on the left wall of a
peak, then hold the left mouse button down wile dragging the pointer
over to the right wall of the peak. The program will then draw a
line located at the center point between these two walls, and will
print out this frequency below the line. If you just click
without dragging, it draws a line and lists the frequency at that
point. An example of a plot after using the peak location
function is shown below:
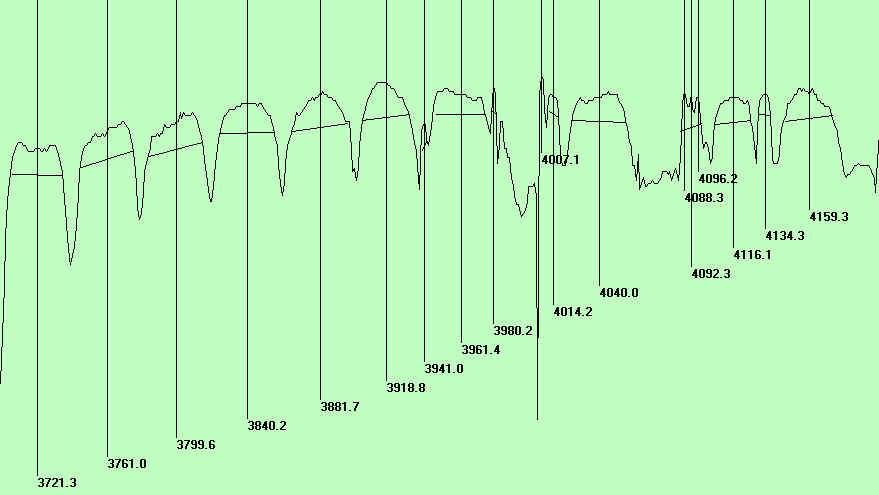
You will notice
that the frequencies identified are probably off a little, for example,
the 3721.3 peak was actually at 3720.0, however this small error is not
far enough off to stop you from getting a lock on a DVB receiver, plus
you will soon learn a little technique with respect to where to choose
your points at the walls of the peak, which affects the center point
slightly.
In
addition to locating the frequency of the peaks, you can get an idea of
the SR values of the peak by observing the width of the peak, and can
usually differentiate DCII signals from DVB signals. I have
included a new version of the program, called BLSCN9.EXE, which is the
same program, except that in addition to the frequency, it also prints
out the frequency difference between the two points chosen. It
was hoped that this would help estimate the SR values of the signal,
however it is quite crude, and doesn't work very well, and is usually
too far off to be of use, although again, with practice, you might be
able to develop a technique of choosing the 2 points such that the
results are useful. Since the printouts are more congested with
this peak width data, I thought it best to have 2 versions, one being
the more simple version not including this data.
Anyway,
hopefully this program can help identify new satellite signals.
Since blind scan DVB receivers often miss narrow signals, you can
sometimes re-scan in narrow mode when you see narrow peaks that are
missed in the normal scan. Also, if you have an analog sat
receiver with a baseband output, you can feed the baseband output to a
short wave receiver with FM mode, to determine the SR values very
accurately. The SW receiver will show a strong quieting signal at
the SR value. For example if you tune the analog sat receiver to
1430 MHz on the above satellite (G-11), which is transponder #1 3720
MHz signal, you will get a strong quieting signal at 26.700
MHz , which is the SR value of the WB signal on this transponder.
Anyway, using the BLSCAN program in conjunction with
the BJBLSCAN program, you can locate the frequency of satellite
signals, and then estimate the SR values by other methods.
I am including a sample BLOUT.CSV file, that I recently
scanned from G10r, C-band. You will notice SEVERAL signals on
this scan which are not listed in the usual databases. A couple
of them I'm pretty sure are DCII megapipe, due to the sharp square
sides. You will also notice that my polarity is off,
because I'm picking up some horizontal signals even though this is a
scan of vertical polarity.
Also. This program, bjblscan.exe, was written with
Visual Basic version 3, and thus should run on any version of windows
from Windows 3.1 through Windows-XP, but you need the VBRUN300.dll file
present. It can either be in the same directory, or in the
windows/system directory. If it won't run for some reason on your
computer, I can re-compile it with VB6 or VB5, but this shouldn't be
necessary. The only versions of windows I've had problems with
are some early versions on NT. I prefer to use VB3 because it
will run on my older computers as well as the newer ones.
I have uploaded a second file, http://www.eskerridge.com/bj/sat/bjblscan2.zip
which includes the VBRUN300.dll if you don't have it already.
Good luck, and if you have any suggestions or encounter any problems,
let me know at wejones@megalink.net .